Image Details
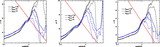
Caption: Fig. 7.
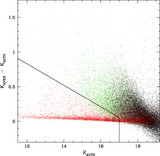
Distribution of K‐band magnitudes for the observed objects. The filled histogram represents the 2 σ limiting magnitudes of the nondetections. The solid vertical line represents the K‐band magnitude for a galaxy at our expected lower redshift limit of ﹩z=1.7﹩, and the hatched area represents the approximate scatter given the K‐z diagram at this redshift.
Other Images in This Article
Show More
Copyright and Terms & Conditions
© 2006. The American Astronomical Society. All rights reserved. Printed in U.S.A.
Copyright ©
2025 Astronomy Image Explorer. All Rights Reserved.