Image Details
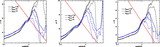
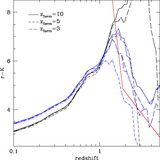
Caption: Fig. 10.
Histogram of redshifts inferred from the K‐z diagram divided into ﹩\alpha < 0.8﹩ (hatched region) and ultrasteep ﹩\alpha > 0.8﹩ emphasizing the presence at high redshift (﹩z_{K- z}> 2﹩) of flatter spectrum sources.
Other Images in This Article
Show More
Copyright and Terms & Conditions
© 2006. The American Astronomical Society. All rights reserved. Printed in U.S.A.
Copyright ©
2025 Astronomy Image Explorer. All Rights Reserved.