Image Details
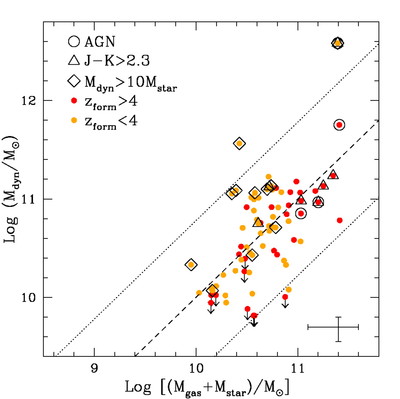
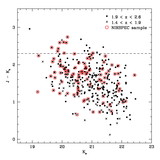
Caption: Fig. 17.
Combined gas and stellar mass ﹩M_{\mathrm{gas}\,}+M_{\star }﹩ vs. dynamical mass ﹩M_{\mathrm{dyn}\,}﹩; cf. Fig. 7. The dashed line shows equal masses, and the dotted lines show a factor of ~6 difference between the masses. The correlation is significant at the 4 σ level, and the masses of 85% of the objects agree to within a factor of 3. Neglecting AGNs, the average dynamical mass is 1.2 times larger than the average baryonic mass. Symbols are as in Fig. 7, with the addition that galaxies with inferred formation redshifts (discussed in § 7) ﹩z_{\mathrm{form}\,}> 4﹩ are shown in red, and those with ﹩z_{\mathrm{form}\,}< 4﹩ are shown in orange. Typical uncertainties are shown by the error bars in the lower left corner, which for dynamical masses include only measurement errors in ﹩r_{\mathrm{H}\,\alpha }﹩ and σ. Uncertainties in dynamical masses are dominated by the unknown factors in the mass model, as discussed in the text; the dotted lines indicate approximate uncertainties in the mass comparison including this additional source of error.
Other Images in This Article
Show More
Copyright and Terms & Conditions
© 2006. The American Astronomical Society. All rights reserved. Printed in U.S.A.
Copyright ©
2025 Astronomy Image Explorer. All Rights Reserved.