Image Details
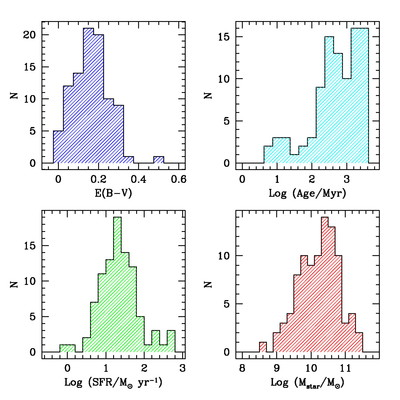
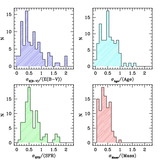
Caption: Fig. 5.
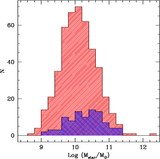
Histograms showing the distributions of the results of the SED modeling. From left to right and top to bottom, we show ﹩E( B-V) ﹩, age, SFR, and stellar mass. Statistics of the distributions are given in the text.
Other Images in This Article
Show More
Copyright and Terms & Conditions
© 2006. The American Astronomical Society. All rights reserved. Printed in U.S.A.
Copyright ©
2025 Astronomy Image Explorer. All Rights Reserved.