Image Details
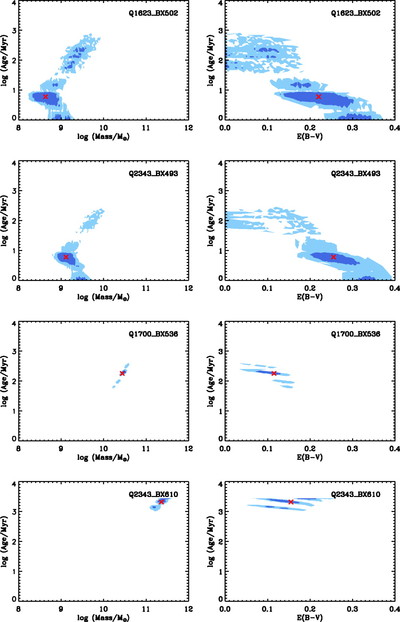
Caption: Fig. 4.
Sample confidence intervals for the fitted parameters, for four galaxies in the sample. Contours of stellar mass vs. age are shown on the left, and ﹩E( B-V) ﹩ vs. age on the right. The dark and light blue regions represent 68% and 95% confidence intervals, respectively, and the red cross marks the adopted best fit. The top two objects are characteristic of the young, low stellar mass galaxies in the sample; the third row shows a typical galaxy, with fit very well constrained by the addition of mid‐IR IRAC data; and the bottom panel shows one of the most massive galaxies in the sample, which can only be fit by an old stellar population. Plots are shown with the same axes for ease of comparison.
Other Images in This Article
Show More
Copyright and Terms & Conditions
© 2006. The American Astronomical Society. All rights reserved. Printed in U.S.A.