Image Details

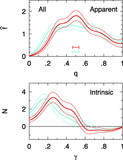
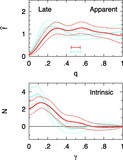
Caption: Fig. 6.
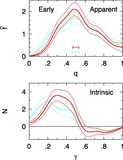
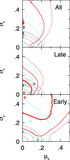
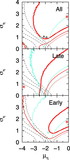
Top: Asterisks indicate the best‐fitting values of μγ and σγ to the complete sample of LGA spirals; the heavy solid line, light solid line, and dotted line indicate the ﹩P=0.5﹩, 0.1, and 0.01 isoprobability contours, found by a χ2 fit. Red indicates shapes deduced from Ks data; blue indicates shapes deduced from B data. Middle: Same as top, but for spirals of Hubble type Sc or later. Bottom: Same as top and bottom, but for spirals of type Sbc or earlier. F indicates fits of Fasano et al. (1993); H indicates fit of Huizinga & van Albada (1992) for Sc spirals.
Other Images in This Article
Copyright and Terms & Conditions
© 2006. The American Astronomical Society. All rights reserved. Printed in U.S.A.
Copyright ©
2025 Astronomy Image Explorer. All Rights Reserved.