Image Details
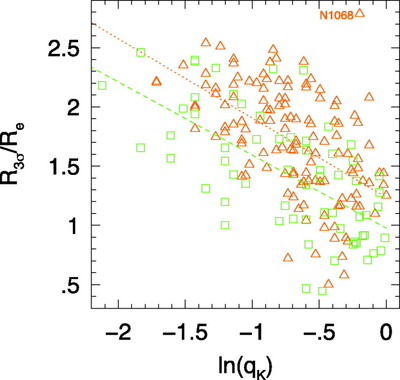
Caption: Fig. 2.
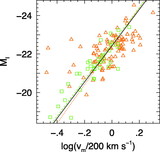
Semimajor axis R3 σ of the 3 σ isophote, measured in units of the half‐light radius Re of the best Sersic profile, plotted as a function of the axis ratio qK. Squares indicate late spirals; the dashed line is the best fit to their R3 σ/Re vs. ﹩\mathrm{ln}\,q_{K}﹩ relation. Triangles indicate early spirals; the dotted line is the best fit to their R3 σ/Re vs. ﹩\mathrm{ln}\,q_{K}﹩ relation. The labeled outlier, NGC 1068, is excluded from the fit.
Other Images in This Article
Copyright and Terms & Conditions
© 2006. The American Astronomical Society. All rights reserved. Printed in U.S.A.
Copyright ©
2025 Astronomy Image Explorer. All Rights Reserved.