Image Details
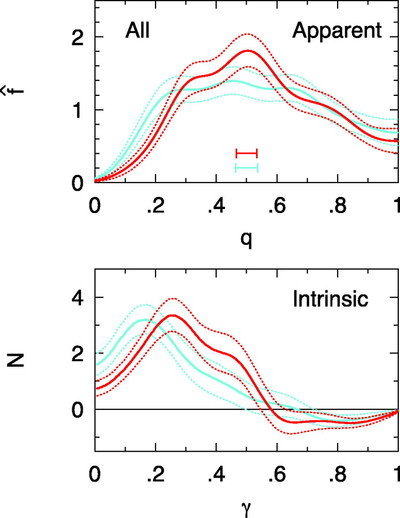
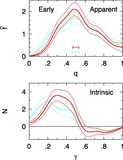
Caption: Fig. 3.
Top: Distribution of apparent axis ratios for the inclination‐adjusted sample of 2MASS LGA spirals. Red lines indicate the Ks axis ratios; blue lines indicate the B axis ratios. The solid line in each case is the best fit, while the dotted lines indicate the 80% confidence interval estimated from bootstrap resampling. The horizontal error bars show the initial kernel width h. Bottom: Distribution of intrinsic axis ratios, assuming the spirals are randomly oriented oblate spheroids.
Other Images in This Article
Copyright and Terms & Conditions
© 2006. The American Astronomical Society. All rights reserved. Printed in U.S.A.
Copyright ©
2025 Astronomy Image Explorer. All Rights Reserved.