Image Details
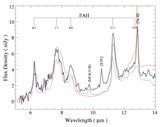
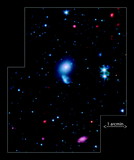
Caption: Fig. 6.
Spitzer IRS spectra of emission lines detected in TDG‐S (histogram). The lines were fit with a Gaussian profile combined with a first‐order polynomial fit to the continuum (solid line). The lines are from IRS‐SH/LH, except 0–0 S(3), which was observed with IRS‐SL. All lines were detected in both nod positions except for the 0–0 S(2) line.
Other Images in This Article
Show More
Copyright and Terms & Conditions
© 2006. The American Astronomical Society. All rights reserved. Printed in U.S.A.
Copyright ©
2025 Astronomy Image Explorer. All Rights Reserved.