Image Details
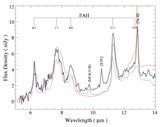
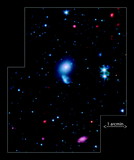
Caption: Fig. 5.
Spitzer spectra of emission lines detected in TDG‐N (histogram). The lines were fit with a Gaussian profile combined with a first‐order polynomial fit to the continuum (solid line). The lines are from IRS‐SH/LH, except 0–0 S(3), which was observed with IRS‐SL.
Other Images in This Article
Show More
Copyright and Terms & Conditions
© 2006. The American Astronomical Society. All rights reserved. Printed in U.S.A.
Copyright ©
2025 Astronomy Image Explorer. All Rights Reserved.