Image Details
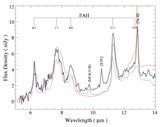
Caption: Fig. 2.
Spitzer IRS spectra of TDG‐N. Top: IRS‐SL spectrum showing strong PAH features and 0–0 S(3) 9.7 μm molecular hydrogen. Bottom: Combined IRS‐SH and IRS‐LH spectrum showing PAHs and fine‐structure lines. The flattening of the continuum emission beyond ﹩\lambda > 20﹩ μm signifies the absence of a dominant cool 40 K dust component.
Other Images in This Article
Show More
Copyright and Terms & Conditions
© 2006. The American Astronomical Society. All rights reserved. Printed in U.S.A.
Copyright ©
2025 Astronomy Image Explorer. All Rights Reserved.