Image Details
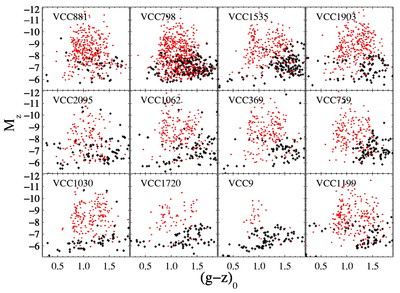
Caption: Fig. 9.
Color‐magnitude diagram, ﹩( g-z) - M_{z}﹩, of globular clusters (gray or red) and diffuse star clusters (black) in the 12 galaxies listed in Table 1. Both samples have been statistically cleaned of background objects using control fields. Globular clusters have ﹩P_{\mathrm{GC}\,}> 0.5﹩, while the diffuse cluster population is defined to have ﹩r_{h}> 4﹩ pc and ﹩P_{\mathrm{GC}\,}< 0.2﹩. The diffuse population is typically fainter than the turnover of the GC luminosity function, and as red or redder than the red GCs.
Other Images in This Article
Show More
Copyright and Terms & Conditions
© 2006. The American Astronomical Society. All rights reserved. Printed in U.S.A.
Copyright ©
2025 Astronomy Image Explorer. All Rights Reserved.