Image Details
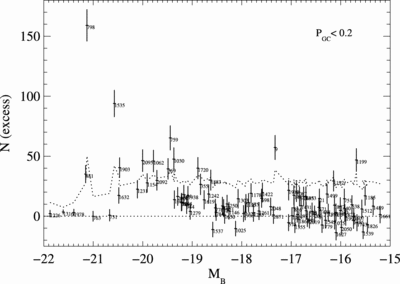
Caption: Fig. 3.
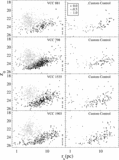
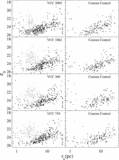
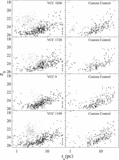
Number of non‐GCs vs. galaxy absolute B magnitude. We show the number of objects with GC probabilities less than 0.2 and ﹩r_{h}> 4﹩ pc that are in excess of what is expected for the background as estimated from the control fields. Numbers alongside the points are the VCC numbers for each galaxy. The dotted line represents a 3 σ value in the excess distribution. Note that while VCC 798 is the largest outlier, a number of galaxies, notably around ﹩M_{B}=-20﹩, have a significant excess of objects in this region of parameter space.
Other Images in This Article
Show More
Copyright and Terms & Conditions
© 2006. The American Astronomical Society. All rights reserved. Printed in U.S.A.
Copyright ©
2025 Astronomy Image Explorer. All Rights Reserved.