Image Details
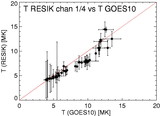
Caption: Fig. 5.
Left: Measured ratios of the principal satellite feature at 5.82 Å (marked D) to the Si XIII ﹩w_{3}+y_{3}﹩ line at 5.681 Å during the four flares of Table 1, plotted against ﹩T_{e}﹩ measured from GOES data. Filled circles denote line fluxes from Gaussian fits; open circles denote line fluxes from total flux above continuum level. The solid line is the calculated ratio. Right: Measured ratios plotted against ﹩T_{0}﹩ for ﹩\mathrm{DEM}\,=\mathrm{exp}\,( -T_{e}/ T_{0}) ﹩. The solid line is the calculated curve.
Other Images in This Article

Copyright and Terms & Conditions
© 2006. The American Astronomical Society. All rights reserved. Printed in U.S.A.
Copyright ©
2025 Astronomy Image Explorer. All Rights Reserved.