Image Details
Caption: Fig. 1.
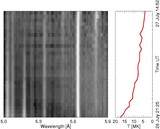
Top panels: RESIK spectra (absolute flux units) in the 5.15–6.0 Å range during the flare of 2002 July 26/27 at 27/10:03:32–10:21:56 UT (integrated over 1104 s; left) and 27/05:13:42–05:29:57 UT (976 s; right), showing the Si XIII ﹩w_{3}﹩, ﹩w_{4}﹩, and ﹩w_{5}﹩ lines and nearby Si XII satellites. Components making up the ﹩n=3﹩ satellite feature are marked B, C, and D (see text). The Si XIV Lyβ line (marked) is at 5.22 Å. The temperatures determined from the ratio of emission in RESIK channel 1 to channel 4 were 4.3 and 6.0 MK. Bottom panels: Synthetic spectra with ﹩T_{e}=4.3﹩ MK (left) and 6.0 MK (right) and Gaussian line profiles with thermal Doppler profiles (ion temperatures assumed equal to ﹩T_{e}﹩) and with ﹩\mathrm{FWHM}\,=15.7﹩ mÅ to match the spectral resolution of RESIK channel 4. The Si XIII ﹩w_{3}﹩, ﹩w_{4}﹩, and ﹩w_{5}﹩ lines are included, as are the Si XII ﹩n=4﹩ and 5 satellites.
Other Images in This Article

Copyright and Terms & Conditions
© 2006. The American Astronomical Society. All rights reserved. Printed in U.S.A.