Image Details
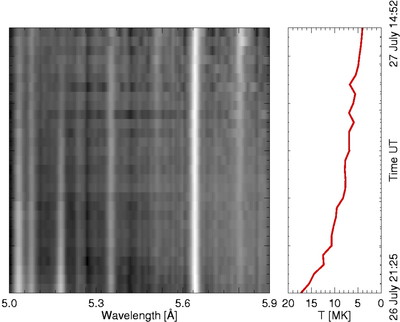
Caption: Fig. 3.
RESIK channel 4 spectra in the wavelength range 5.0–5.9 Å during the flare on 2002 July 26/27. The 29 spectra in gray‐scale format (left) are stacked vertically (earliest times at the bottom, starting at 26/21:25 UT); they were integrated over periods from 2.5 minutes (near flare maximum) to 18 minutes (end of the flare). Bright emission lines are shown as vertical white streaks: they may be identified from Table 2. The increasing flux of the Si XII satellite feature at 5.82 Å and decreasing flux of the Si XIII 5.681 Å line as the flare emission and GOES temperature decline (right) are evident.
Other Images in This Article

Copyright and Terms & Conditions
© 2006. The American Astronomical Society. All rights reserved. Printed in U.S.A.