Image Details
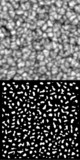
Caption: Fig. 9.
Top: Average ﹩H^{\prime }_{\mathrm{hex}\,}( r) ﹩ relative to the F data set for integration times ranging from 5 to 25 minutes, with steps of 5 minutes. The solid line represents the mean ﹩\langle H^{\prime }_{\mathrm{hex}\,}( r) \rangle ﹩ entropy calculated averaging 512 ﹩H^{\prime }_{\mathrm{hex}\,}( r) ﹩ functions relative to single two‐level granulation images; the strong clustering scale at ﹩r\simeq 1﹩ Mm corresponds to the average granular scale. Very quickly the granules show a tendency to form clusters characterized by a spatial scale around 8 Mm. Bottom: Average ﹩H^{\prime }_{\mathrm{hex}\,}( r) ﹩ functions, with the same integration times, relative to the S data set.
Other Images in This Article
Copyright and Terms & Conditions
© 2005. The American Astronomical Society. All rights reserved. Printed in U.S.A.