Image Details
Caption: Fig. 1.
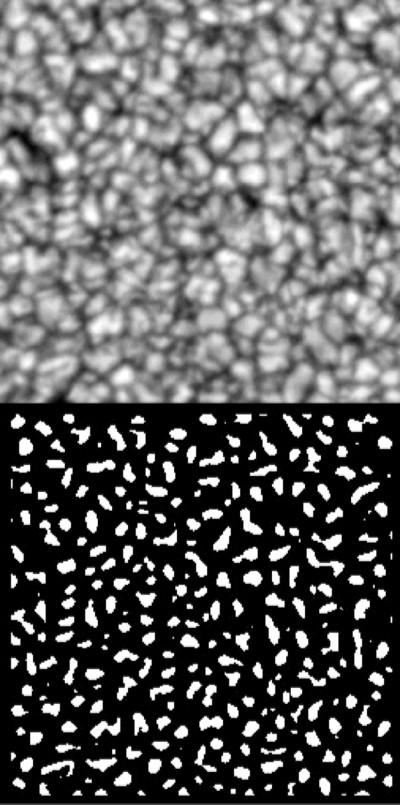
Top: Subarray of ﹩256\times 256﹩ pixels, corresponding to a region of ![]() ﹩31\farcs 5\times 31\farcs 5﹩, belonging to the DST96 data set. Bottom: Corresponding two‐level representation of a solar intensity image.
﹩31\farcs 5\times 31\farcs 5﹩, belonging to the DST96 data set. Bottom: Corresponding two‐level representation of a solar intensity image.
Other Images in This Article

Copyright and Terms & Conditions
© 2005. The American Astronomical Society. All rights reserved. Printed in U.S.A.
Copyright ©
2025 Astronomy Image Explorer. All Rights Reserved.