Image Details
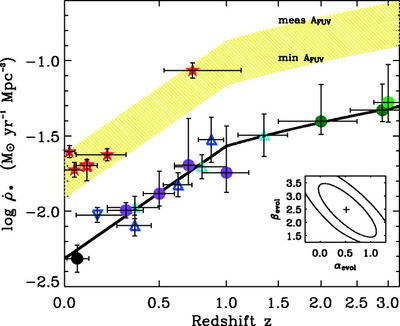
Caption: Fig. 5.
SFR density vs. z. Filled circles from measurements at 1500 Å (uncorrected for dust) same as in Fig. 1. Blue comparison points are rest‐frame UV measurements uncorrected for dust attenuation. Inverted blue triangle from Sullivan et al. (2000). Dark blue triangles from Lilly et al. (1996). Light blue triangles from Wilson et al. (2002) for ﹩\alpha =-1.5﹩. Solid line rises as ﹩( 1+z) ^{2.5}﹩ for ﹩z< 1﹩ and then ﹩( 1+z) ^{0.5}﹩ for ﹩z> 1﹩ based on χ2 fit to our sample (see inset; 1 σ and 2 σ confidence contours shown). Shaded region shows range corresponding to maximum/minimum dust attenuation. Filled red stars from dust‐corrected Hα measurements (with increasing redshift) from Pérez‐González et al. (2003), Gronwall (1999), Tresse & Maddox (1998), and Tresse et al. (2002). Open red star from SDSS (Hα/emission line; Brinchmann et al. 2004).
Other Images in This Article

Copyright and Terms & Conditions
© 2005. The American Astronomical Society. All rights reserved. Printed in U.S.A.