Image Details
Caption: Fig. 4.
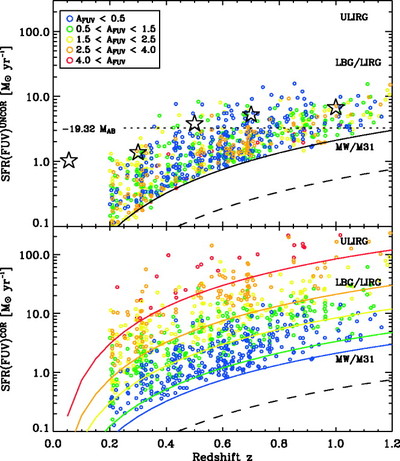
SFR of GALEX‐VVDS galaxies vs. redshift using Kennicutt (1998) conversion. Top: Uncorrected SFR for galaxies with varying AFUV. Solid line and dashed line correspond to ﹩\mathrm{NUV}\,< 24.5﹩ (current sample) and ﹩\mathrm{NUV}\,< 26﹩ (GALEX Ultra‐Deep Survey) limits. Stars show values for L![]() from Paper I and Wyder et al. (2005). Dotted line corresponds to ﹩L_{\mathrm{min}\,}=0.2L_{\star ,\, z=3}﹩ cut. Bottom: Attenuation‐corrected SFRs. Symbols same as top panel. Colored lines correspond to detection limits for ﹩\mathrm{NUV}\,< 24.5﹩ at minimum attenuation level for each subsample.
from Paper I and Wyder et al. (2005). Dotted line corresponds to ﹩L_{\mathrm{min}\,}=0.2L_{\star ,\, z=3}﹩ cut. Bottom: Attenuation‐corrected SFRs. Symbols same as top panel. Colored lines correspond to detection limits for ﹩\mathrm{NUV}\,< 24.5﹩ at minimum attenuation level for each subsample.
Other Images in This Article

Copyright and Terms & Conditions
© 2005. The American Astronomical Society. All rights reserved. Printed in U.S.A.
Copyright ©
2025 Astronomy Image Explorer. All Rights Reserved.