Image Details
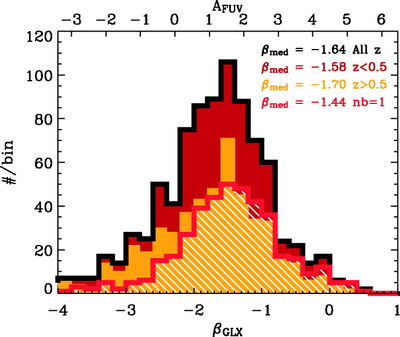
Caption: Fig. 3.
Histogram of FUV slope ﹩\beta _{GLX}﹩ for 888 galaxies with measurements in U band (black) and split into two subsamples: ﹩z< 0.5﹩ (brown) and ﹩z> 0.5﹩ (orange). Red/white: Distribution of ﹩\beta _{GLX}﹩ for "isolated" GALEX detections with only one optical counterpart within 4﹩\arcsec﹩ radius.
Other Images in This Article

Copyright and Terms & Conditions
© 2005. The American Astronomical Society. All rights reserved. Printed in U.S.A.
Copyright ©
2025 Astronomy Image Explorer. All Rights Reserved.