Image Details
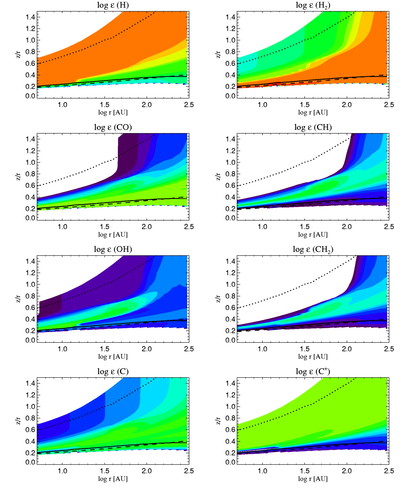
Caption: Fig. 7.
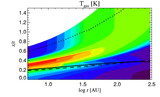
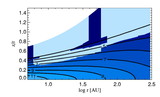
Abundances of selected species in the standard disk model: H, H2, C, C﹩^{+}﹩, CO, CH, OH, and CH2. See Fig. 2 for the meaning of the overplotted lines. The colors correspond to logarithmic abundances in steps of 1 and range from ﹩\mathrm{log}\,\epsilon =-14﹩ to 0.
Other Images in This Article


Copyright and Terms & Conditions
© 2004. The American Astronomical Society. All rights reserved. Printed in U.S.A.
Copyright ©
2025 Astronomy Image Explorer. All Rights Reserved.