Image Details
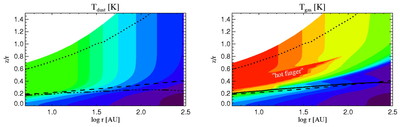
Caption: Fig. 2.
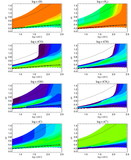
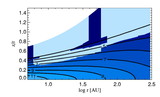
Dust and gas temperatures in the standard disk model. The solid line indicates the location below which gas and dust temperatures agree to within 10% (right panel). If over an interval ﹩\delta z/ z\sim 0.3﹩ both temperatures agree within 2%, complete coupling, that is ﹩T_{\mathrm{gas}\,}=T_{\mathrm{dust}\,}﹩, is adopted below this depth (dash‐dotted line, left panel). The 10% agreement occurs at or slightly above the ﹩\tau =1﹩ surface layer (dashed line). The region around the ﹩\tau =1﹩ surface, where the gas temperature contours change their slope and the gas temperature drops below the dust temperature, is referred to as the undershoot region (see Figs. 5 and 6). The dotted line marks the transition between the surrounding cloud and the disk. The colors correspond to the following temperatures: 10, 20, 30, 40, 50, 60, 70, 80, 90, 100, 200, 500, 1000, 2000, and 5000 K.
Other Images in This Article


Copyright and Terms & Conditions
© 2004. The American Astronomical Society. All rights reserved. Printed in U.S.A.