Image Details
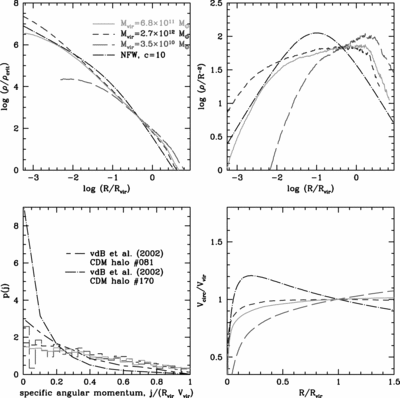
Caption: Fig. 1.
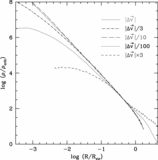
Dark matter halos generated using standard initial conditions, as described in § 4.3. Halos of three different galactic‐type masses are shown; the intermediate‐mass halo (solid line) is the reference halo. Top left: log‐log density profiles. The lowest mass halo is not resolved at ≲1% of ﹩R_{\mathrm{vir}\,}﹩. An NFW ﹩c=10﹩ halo is shown for comparison (dot‐dashed line). Top right: Density profiles with the slope of ﹩\alpha =2﹩ divided out, so ﹩\alpha =2﹩ slopes are flat in this plot. Bottom right: Circular rotation curves. Bottom left: Distribution of SAMs in our halos, as histograms. For comparison, we include two extreme SAM distributions taken from N‐body simulations of van den Bosch et al. (2002).
Other Images in This Article
Copyright and Terms & Conditions
© 2004. The American Astronomical Society. All rights reserved. Printed in U.S.A.