Image Details
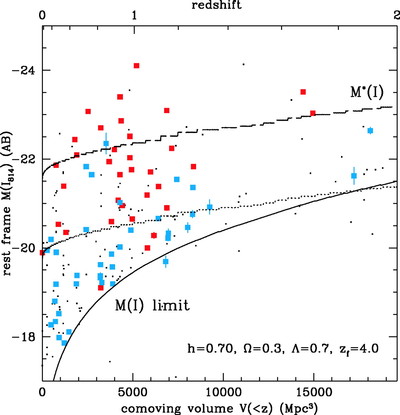
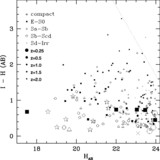
Caption: Fig. 18.
Rest‐frame M(I814) vs. the comoving volume of the whole survey for the two early‐type samples: the red, solid points are the primary sample and blue, open points are the secondary sample. Non–early‐type galaxies are shown by small dots. Spectroscopic redshifts are used when available. The limiting absolute magnitude of the ﹩H< 24.0﹩ sample is shown by a solid curve. The predicted change in M(I814) for an L* galaxy is represented by the dashed line, calculated using a BC model with a 0.1 Gyr burst of Z⊙ stars formed at ﹩z_{f}=4.0﹩ followed by PLE. The dotted line is ~2 mag less luminous than the predicted M*(I814).
Other Images in This Article
Show More
Copyright and Terms & Conditions
© 2004. The American Astronomical Society. All rights reserved. Printed in U.S.A.