Image Details
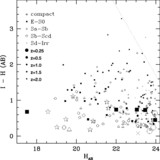
Caption: Fig. 6.
Plot of the re determined by our profile fitting vs. the input re for two sets of model elliptical galaxies. The open squares represent models with ﹩H_{160}=20.0﹩, the solid triangles those with ﹩H_{160}=22.0﹩, and the open circles those with ﹩H_{160}=24.0﹩. The points have been offset slightly in the horizontal direction for clarity. Error bars representing 1 σ are shown on each point.
Other Images in This Article

Show More
Copyright and Terms & Conditions
© 2004. The American Astronomical Society. All rights reserved. Printed in U.S.A.
Copyright ©
2025 Astronomy Image Explorer. All Rights Reserved.