Image Details
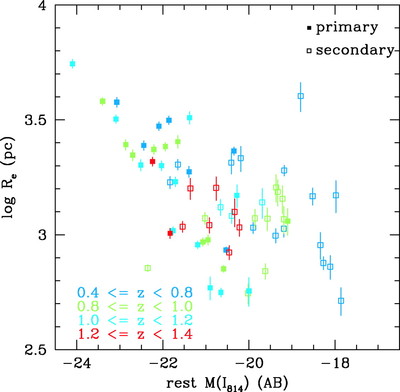
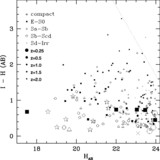
Caption: Fig. 17.
Log of the Re vs. M(I814) for the two early‐type samples. One σ error bars are shown on each point based on simulations of the re measurements. The point color encodes the redshift as indicated in the legend. The values of Re have been corrected for the bias in measuring re found in our simulations and seen in Figure 6.
Other Images in This Article
Show More
Copyright and Terms & Conditions
© 2004. The American Astronomical Society. All rights reserved. Printed in U.S.A.
Copyright ©
2025 Astronomy Image Explorer. All Rights Reserved.