Image Details
Caption: Fig. 15.
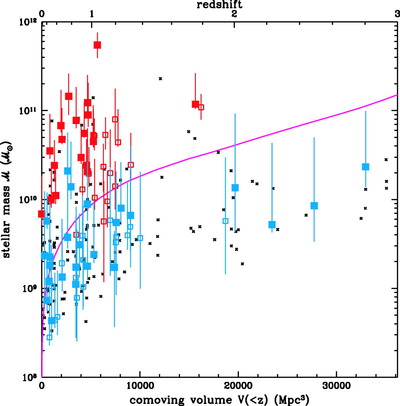
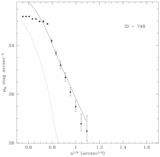
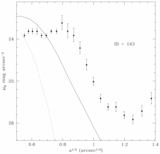
Estimated stellar mass against comoving volume and redshift for all galaxies in the HDF‐N with ﹩H_{160}< 24.0﹩. The primary sample are plotted in red and the secondary sample are in blue. Open squares indicate photometric redshifts, and solid squares are spectroscopic redshifts. The error bars show the 68% confidence range on mass, where the upper error bar comes from the 1 σ upper limit from the two‐component models, and the lower error bar shows the 1 σ lower limit from the one‐component model (see Papovich et al. 2001 for details). The small black crosses are the non–early‐type galaxies. The magenta line shows the mass limit corresponding to ﹩H_{160}=24.0﹩ for a PLE star burst formed at ﹩z=\infty ﹩.
Other Images in This Article
Show More
Copyright and Terms & Conditions
© 2004. The American Astronomical Society. All rights reserved. Printed in U.S.A.