Image Details
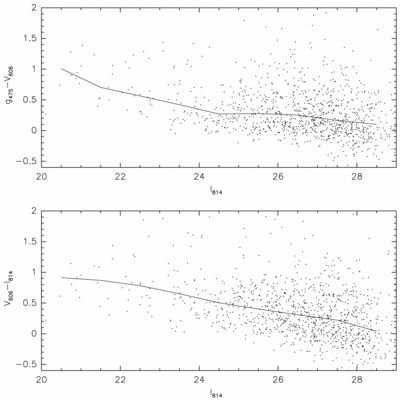
Caption: Fig. 20.
Median color as a function of magnitude. The upper and lower panels show, respectively, the ﹩g﹩−V and V−I isophotal colors of galaxies plotted as a function of their MAG_AUTO I magnitude. The solid lines represent the median color of the galaxies.
Other Images in This Article


Show More
Copyright and Terms & Conditions
© 2004. The American Astronomical Society. All rights reserved. Printed in U.S.A.
Copyright ©
2025 Astronomy Image Explorer. All Rights Reserved.