Image Details
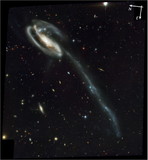
Caption: Fig. 5.
Number of expected spurious detections, caused by noise caused by noise fluctuations, as a function of magnitude (see text). The thin solid line corresponds to the central part of the VV 29 field (see Table 1), the dashed line to the outer VV 29 field and the NGC 4676 field, and the thick solid line to the whole field.
Other Images in This Article


Show More
Copyright and Terms & Conditions
© 2004. The American Astronomical Society. All rights reserved. Printed in U.S.A.
Copyright ©
2025 Astronomy Image Explorer. All Rights Reserved.