Image Details
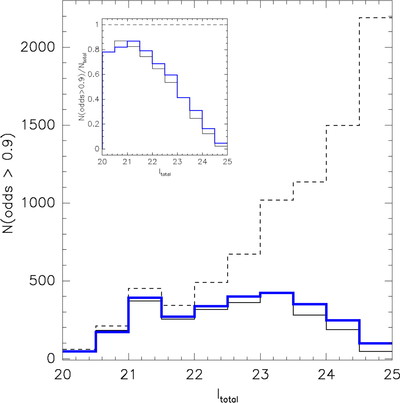
Caption: Fig. 15.
Distribution of galaxies with Bayesian ﹩\mathrm{odds}\,> 0.9﹩ (photometric redshifts with lower values are unreliable) in our simulations as a function of magnitude. This shows that there are few objects with good quality photometric redshifts for ﹩I\gtrsim 24.5﹩. The thick line corresponds to isophotal magnitudes, and the thin line to Kron apertures; the figure shows that isophotal magnitudes improve the accuracy of the photometric redshifts. The dashed line corresponds to the total number of objects.
Other Images in This Article


Show More
Copyright and Terms & Conditions
© 2004. The American Astronomical Society. All rights reserved. Printed in U.S.A.
Copyright ©
2025 Astronomy Image Explorer. All Rights Reserved.