Image Details
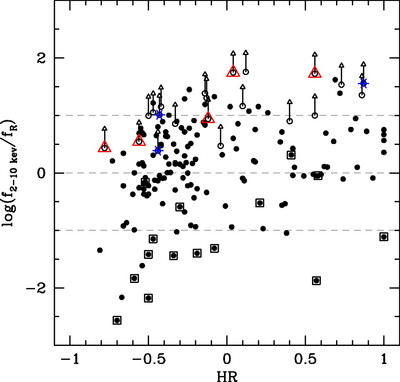
Caption: Fig. 9.
X‐ray–to–optical flux ratio log(f2–10 keV/fR) vs. X‐ray hardness ratio HR. Lower limits of log(f2–10 keV/fR) are plotted for sources without R‐band counterparts. Dashed lines show location of constant X‐ray–to–optical flux ratio of +1, 0, and ‐1. Dots enclosed by squares are optically extended sources, open circles enclosed by triangles are R‐band nondetected sources, which show up in redder bands (I and z﹩\arcmin﹩), and stars are sources detected only in bluer bands (BW and V).
Other Images in This Article
Show More
Copyright and Terms & Conditions
© 2004. The American Astronomical Society. All rights reserved. Printed in U.S.A.
Copyright ©
2025 Astronomy Image Explorer. All Rights Reserved.