Image Details
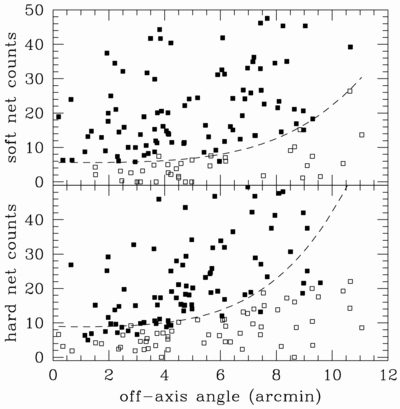
Caption: Fig. 4.
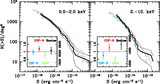
Soft (0.5–2.0 keV) and hard (2.0–7.0 keV) band net counts vs. off‐axis angle. The two dashed lines are the threshold we chose to build complete samples for log N–log S calculation. The net counts are derived from X‐ray photometry. Thus, for each source we can give the net count for each band, whether it is detected in the band or not. Top: Sources detected in the soft band (filled squares), and those not detected in the soft band (open squares). Bottom: Sources detected in the hard band (filled squares), and those not detected in the hard band (open squares).
Other Images in This Article
Show More
Copyright and Terms & Conditions
© 2004. The American Astronomical Society. All rights reserved. Printed in U.S.A.
Copyright ©
2025 Astronomy Image Explorer. All Rights Reserved.