Image Details
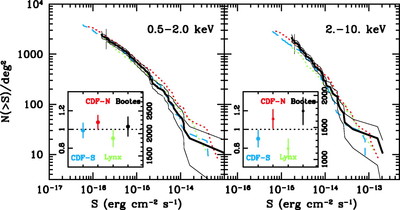
Caption: Fig. 6.
The log N–log S in the soft (0.5–2.0 keV) and hard (2.0–10.0 keV) bands from 172 ks Chandra observations of the LALA Bootes field. Data are plotted as thick solid lines with two additional thin solid lines enclosing 1 σ Poisson uncertainties. The log N–log S from the CDF‐N, CDF‐S, and Lynx fields are also plotted (see text for details). The inserts show the X‐ray source densities and 1 σ uncertainties from the four fields at the faint end of our 172 ks Chandra exposure (﹩2.0\times 10^{-16}﹩ ergs cm−2 s−1 in the 0.5–2.0 keV band, and ﹩2.0\times 10^{-15}﹩ ergs cm−2 s−1 in the 2.0–10.0 keV band). In the inserts the average source densities from the four fields (dashed lines) are shown, and the scales of the inserts are 0.6–1.4 times the average values.
Other Images in This Article
Show More
Copyright and Terms & Conditions
© 2004. The American Astronomical Society. All rights reserved. Printed in U.S.A.