Image Details
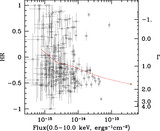
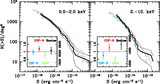
Caption: Fig. 8.
Optical R‐band magnitudes of the X‐ray–detected sources vs. their soft (0.5–2.0 keV) and hard (2–10 keV) X‐ray fluxes. The 3 σ upper limits are plotted for sources without R‐band counterparts. Dotted lines show the location of constant X‐ray–to–optical flux ratio log(fX/fR) of +1, 0, and −1. Dots enclosed by squares are optically extended sources.
Other Images in This Article
Show More
Copyright and Terms & Conditions
© 2004. The American Astronomical Society. All rights reserved. Printed in U.S.A.
Copyright ©
2025 Astronomy Image Explorer. All Rights Reserved.