Image Details
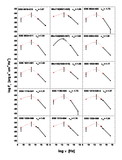
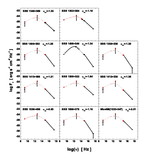
Caption: Fig. 8.
αox vs. ﹩L_{\mathrm{opt}\,}﹩ for the SBS NLS1s. A weak correlation (﹩\alpha _{\mathrm{ox}\,}=0.16\mathrm{log}\,L_{\mathrm{opt}\,}-8.2﹩) can be observed for bright (﹩B\leq 17.5﹩, ﹩z\leq 0.16﹩; squares) sources. The solid line represents the best fit. Weak sources (﹩B> 17.5﹩; circles) are also shown, as well as upper limits (triangles).
Other Images in This Article
Copyright and Terms & Conditions
© 2003. The American Astronomical Society. All rights reserved. Printed in U.S.A.
Copyright ©
2025 Astronomy Image Explorer. All Rights Reserved.