Image Details
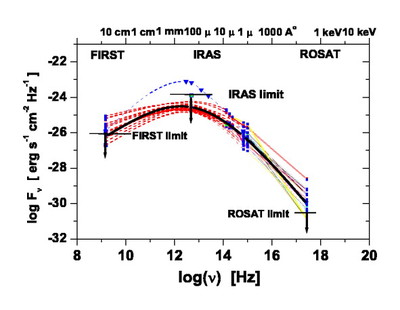
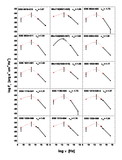
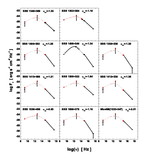
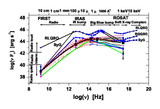
Caption: Fig. 7.
Spectral energy distribution of SBS NLS1s. The dotted lines show the SED for each individual object. (a) A wide spread of indices (﹩-0.93< \alpha _{\mathrm{ox}\,}< 2.01﹩) is observed. The thick solid line represents the mean overall SED. Assuming a power‐law fit for the soft X‐ray–to–optical region, we get a mean value of ﹩\alpha _{\mathrm{ox}\,}=-1.33﹩. (b) In this case, the SEDs of typical radio‐loud QSOs, radio‐quiet QSOs, and Seyfert galaxies are shown for comparison.
Other Images in This Article
Copyright and Terms & Conditions
© 2003. The American Astronomical Society. All rights reserved. Printed in U.S.A.
Copyright ©
2025 Astronomy Image Explorer. All Rights Reserved.