Image Details
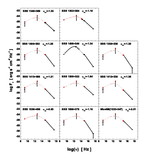
Caption: Fig. 5.
Diagram of ﹩f_{\mathrm{X}\,}/ f_{\mathrm{opt}\,}﹩ as a function of ﹩M_{B}﹩ for SBS NLS1s (−﹩19.0> M_{B}> -23.0﹩, ﹩B< 17.5﹩; diamonds; ﹩N=14﹩), added to the diagram of BQX QSOs of Schmidt & Green (1986; squares; −﹩23.0> M_{B}> -30.0﹩, ﹩N=52﹩). Fainter objects (﹩B> 17.5﹩; stars) and upper limits (triangles) are also represented.
Other Images in This Article
Copyright and Terms & Conditions
© 2003. The American Astronomical Society. All rights reserved. Printed in U.S.A.
Copyright ©
2025 Astronomy Image Explorer. All Rights Reserved.