Image Details
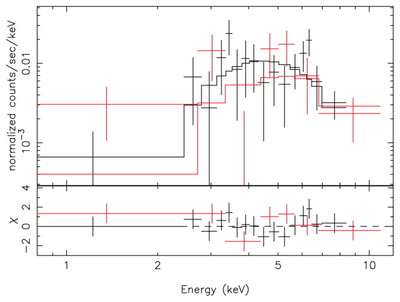
Caption: Fig. 4.
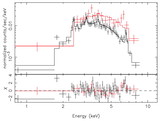
Count spectra from MOS (black data point set) and PN (red data point set) data, extracted from a region of 10﹩\arcsec﹩ radius around Sgr A* during the flare after subtraction of the nonflaring spectra. The spectra are compared to the best‐fit model of an absorbed power law without dust scattering (see Table 2).
Other Images in This Article
Copyright and Terms & Conditions
© 2003. The American Astronomical Society. All rights reserved. Printed in U.S.A.
Copyright ©
2025 Astronomy Image Explorer. All Rights Reserved.