Image Details
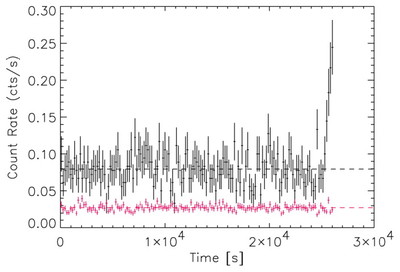
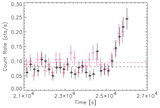
Caption: Fig. 1.
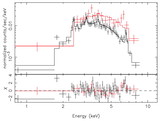
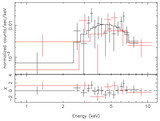
Left: Count rate, sampled in bins of 180 s, collected with both MOS cameras from a region within 10﹩\arcsec﹩ from Sgr A* in the range 2–10 keV (black top curve). An equivalent light curve, collected from a 30﹩\arcsec﹩ radius region centered about 1﹩\arcmin﹩ east of Sgr A* and rescaled by a factor of 0.1 for clarity, is shown for comparison (red bottom curve). Dashed lines indicate the average value computed before the flare. Right: Zoom of the Sgr A* MOS light curve (black circles) around the period of the flare compared with a similar light curve (count rate within 10﹩\arcsec﹩ from Sgr A* in the 2–10 keV band in bins of 180 s) from PN data (red crosses).
Other Images in This Article
Copyright and Terms & Conditions
© 2003. The American Astronomical Society. All rights reserved. Printed in U.S.A.