Image Details
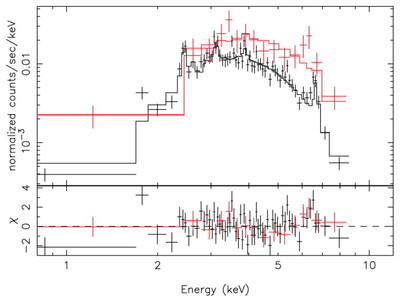
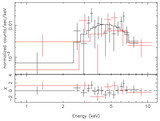
Caption: Fig. 3.
MOS count spectra extracted from a region of 10﹩\arcsec﹩ radius around Sgr A* before the flare (black, bottom data point set) and during the 900 s flare (red, top data point set) compared with the best‐fit models of Table 1.
Other Images in This Article
Copyright and Terms & Conditions
© 2003. The American Astronomical Society. All rights reserved. Printed in U.S.A.
Copyright ©
2025 Astronomy Image Explorer. All Rights Reserved.