

Image Details
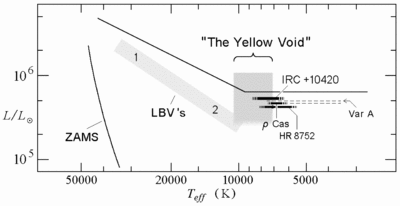
Caption: Fig. 14.
Schematic H‐R diagram showing the position of the yellow void with IRC +10420, Var A in M33, ρ Cas, and HR 8752 and their range in apparent temperature corresponding to their spectral variations (see text). The shell episodes in Var A and ρ Cas are shown as dashed lines. The location of the classical ("1") and less luminous ("2") LBV’s in their quiescent state is shown as a band, also known as the S Doradus instability strip. The solid line is the empirical upper luminosity boundary.
Other Images in This Article
Show More
Copyright and Terms & Conditions
© 2002. The American Astronomical Society. All rights reserved. Printed in U.S.A.

Copyright ©
2026 Astronomy Image Explorer. All Rights Reserved.
