

Image Details
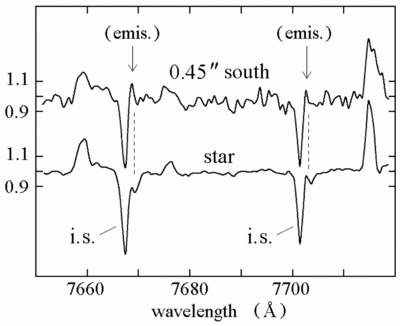
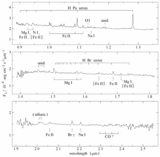
Caption: Fig. 6.
Wavelength region showing the K I emission lines. The strong interstellar K I absorption line and the K I absorption in the star are also identified. The lower curve shows the spectrum on the central star while the upper curve shows the same wavelength region in the ejecta at offset position ﹩\underline{a}﹩ (Fig. 12). The K I emission is clearly present above the continuum level in the ejecta.
Other Images in This Article
Show More
Copyright and Terms & Conditions
© 2002. The American Astronomical Society. All rights reserved. Printed in U.S.A.

Copyright ©
2026 Astronomy Image Explorer. All Rights Reserved.
