Image Details
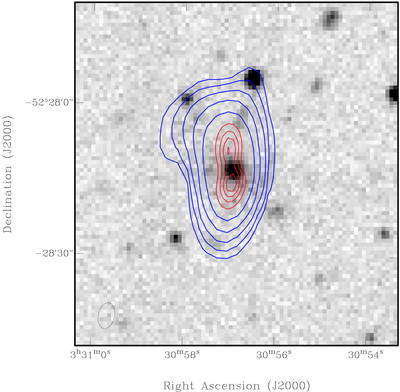
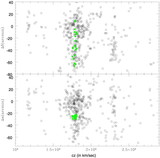
Caption: Fig. 23.
Radio contours from the ATCA data overplotted on the CTIO 0.9 m optical R‐band image. The 20 cm (blue) and 13 cm (red) contours are coincident with a faint galaxy. The higher resolution 13 cm data clearly show the double‐lobed structure of the radio source. Both radio images use uniform weighting. The 20 cm beam is ﹩10\farcs 2\times 6\farcs 3﹩ (﹩\mathrm{P}\,.\mathrm{A}\,.=-11^{\circ }﹩), and the 13 cm beam is ﹩5\farcs 2\times 3\farcs 2﹩ (﹩\mathrm{P}\,.\mathrm{A}\,.=-11^{\circ }﹩). The 20 cm contour levels are 0.5, 1, 2, 4, and 8 mJy beam−1. The 13 cm contour levels are 2, 4, 6, and 8 mJy beam−1.
Other Images in This Article

Show More
Copyright and Terms & Conditions
© 2002. The American Astronomical Society. All rights reserved. Printed in U.S.A.