Image Details
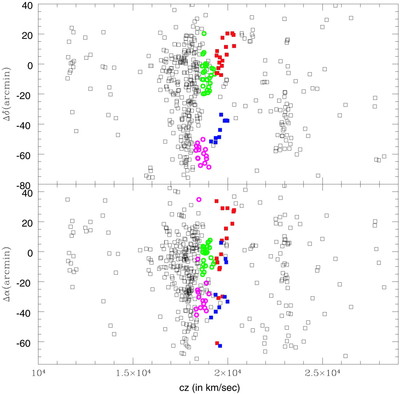
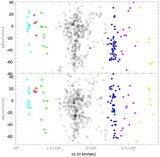
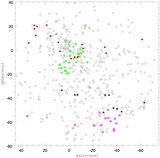
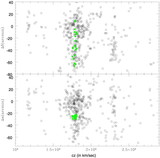
Caption: Fig. 6.
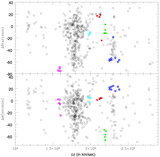
Position‐velocity plots with a number of groups and filaments identified. Red and blue squares are filaments F1 and F2, while the green and magenta open circles are groups G1 and G2.
Other Images in This Article

Show More
Copyright and Terms & Conditions
© 2002. The American Astronomical Society. All rights reserved. Printed in U.S.A.
Copyright ©
2025 Astronomy Image Explorer. All Rights Reserved.