Image Details
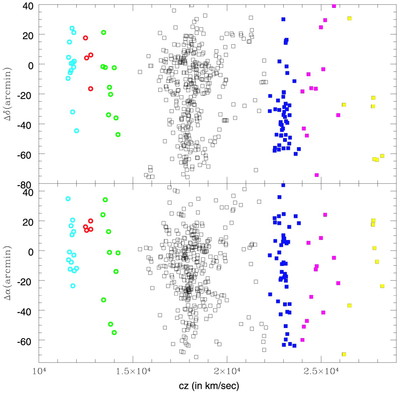
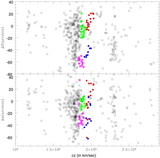
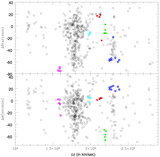
Caption: Fig. 4.
Decl. (top) and R.A. (bottom) plotted vs. redshift for our A3128/A3125 sample. Positions are in arcminutes from the center of A3128. A more restricted redshift range is plotted than in Fig. 3. Various foreground and background redshift slices, discussed in the text, are identified with different colors and symbol types.
Other Images in This Article

Show More
Copyright and Terms & Conditions
© 2002. The American Astronomical Society. All rights reserved. Printed in U.S.A.
Copyright ©
2025 Astronomy Image Explorer. All Rights Reserved.