Image Details
Caption: Fig. 18.
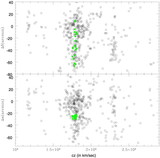
Radial surface brightness profiles are plotted for both the northeast (top) and southwest (bottom) X‐ray peaks vs. radius (left) and ﹩\mathrm{log}\,R﹩ (right)
Other Images in This Article

Show More
Copyright and Terms & Conditions
© 2002. The American Astronomical Society. All rights reserved. Printed in U.S.A.
Copyright ©
2025 Astronomy Image Explorer. All Rights Reserved.