Image Details
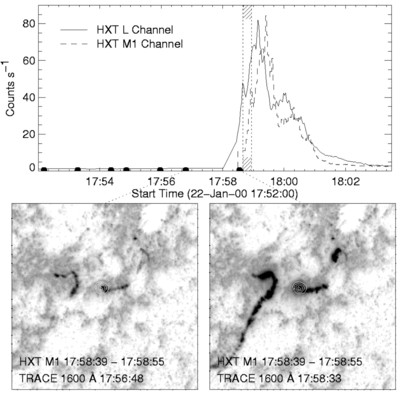
Caption: Fig. 4.
TRACE and HXT data for the 2000 January 22 flare. Top panel: HXT light curves for the L and M1 channels. The hatched area indicates the time interval used for HXT image synthesis. The filled half‐circles indicate the times of the TRACE 1600 Å images. Bottom left panel: TRACE 1600 Å image showing ribbon brightenings prior to the onset of the hard X‐ray emission. Bottom right panel: TRACE 1600 Å image from the initial phase of the hard X‐ray burst. The contours on each image are from the HXT M1 channel and drawn at 4, 6, 8, and 10 counts s−1.
Other Images in This Article
Copyright and Terms & Conditions
© 2001. The American Astronomical Society. All rights reserved. Printed in U.S.A.
Copyright ©
2025 Astronomy Image Explorer. All Rights Reserved.