Image Details
Caption: Fig. 2.
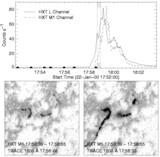
TRACE light curves for the six points indicated in Fig. 1. Each 1600 Å time series is normalized to the maximum value in the time interval shown. The scaling factor is indicated on the plot. Also shown on each plot is the normalized BATSE hard X‐ray light curve. The vertical line represents the assumed onset of the hard X‐ray emission.
Other Images in This Article
Copyright and Terms & Conditions
© 2001. The American Astronomical Society. All rights reserved. Printed in U.S.A.
Copyright ©
2025 Astronomy Image Explorer. All Rights Reserved.