Image Details
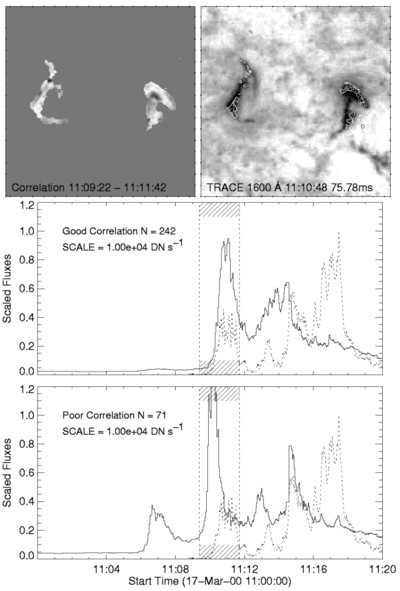
Caption: Fig. 3.
TRACE and BATSE data for the 2000 March 17 flare. Top left panel: Correlation map computed from the TRACE 1600 Å and BATSE light curves for the initial hard X‐ray burst between 11:10 and 11:12 UT. The image is scaled linearly from −1 to 1. White indicates good correlation. Top right panel: TRACE 1600 Å image with the contours from the correlation map superposed. Contours are drawn at 0 (black), 0.6, and 0.8 (white). The field of view and scaling are the same as in Fig. 1. Middle panel: Average TRACE 1600 Å light curve for footpoints that are well correlated ﹩( r> 0.75) ﹩ with the hard X‐rays during the initial burst. The BATSE hard X‐ray data are also shown. Bottom panel: Average TRACE 1600 Å light curve for footpoints that are poorly or anticorrelated ﹩( r< 0) ﹩ with the hard X‐rays during the initial burst.
Other Images in This Article
Copyright and Terms & Conditions
© 2001. The American Astronomical Society. All rights reserved. Printed in U.S.A.